Based on book: Fundamentals of corporate finance fifth edition (Wiley)
Net working capital = current asset - current liabilities
1. Financial manager and the firm:
Role of the financial manager:
Maximizing the price of firm’s stock will maximize value of a firm and the wealth of its shareholders/owners
3 fundamental decisions in financial management
Capital budgeting: identify which long-term assets to acquire to maximize net benefits for the firm
affect long-term assets (productive assets, tangible or intangible)
Financing: determine best way to pay for for short-term and long-term assets
determine firm’s cpital structure
affect long-term debt and equity thatwill be used to finance firm’s long-term productive asset and net working capital
Working capital: decide how to manage short-term resources and obligations by adjusting current assets and current liabilities to promote growth in cash flow
affect current asset and current liabilities
BOD is representative of all shareholders
mostly large shareholders
sometimes independent experts
Consists of:
audit comittee
governance comittee
remuneration committee: manage composation and performance policies
Financial markets include markets for trading financial assets such as stocks and bonds rather than real assets
Financial institutions include banks, credit unions, insurance companies, and finance companies
Financial system at work
Money is collected from small amounts (borrowed) and invested in large amounts (loaned)
System directs money to the best investment opportunities in the economy (return and risk)
→ Lenders earn profit from lending and borrowing spread
How funds flow through the financial system
Directly vs Indirectly:
Directly through financial markets: creation and sale of financial securities directly to leader/saver
borrower/spedner deals with lender/savers
Investment Bank and money center banks help with origination, underwriting and distribution of new debt and equity
Origination is the process of preparing a security issues for sale
Underwriting is a service to assist firms in selling their debt or equity securities in a direct financing market
Distribution is the process of marketing and reselling the securities to investors
Indirectly through financial institution: institutions invest in Financial Assets by collect money from lender/saver and make loans in larger amounts to borrower/spender
Primary: Wholesale market where firms’ new securities are issued and sold for the first time
Secondary: Retail market where previously issued securities are resold (traded)
enable investors to buy and sell securities frequently
active secondary markets → higher price in primary market
→ companies whose securities have active secondary markets enjoy lower funding costs than similar firms whose securities do not have active secondary markets.
no new money goes into the firm when a secondary market transaction takes place.
Marketability is the ease with which a security can be sold and converted into cash. A security’s marketability depends in part on the costs of trading and searching for information, so-called transaction costs
Liquidity is the ability to convert an asset into cash quickly without loss of value
Broker vs Dealer:
Broker bring buys and sellers together and learn commission fee
Dealers buy from sellers, store to inventory and sell to buyers
Exchanges and over-the-counter markets
Exchange: location where sellers and buyers meet to conduct transactions
New York Stock Exchange (NYSE)
Chicago Board Options Exchange (CBOE)
Over-the-Counter Market: dealers conduct transactions over the phone or via computer
National Association of Securities Dealers Automated Quotations (NASDAQ)
Money and capital markets
Money market: market for low-risk securities with maturities of less than one year
Treasury bills (T-Bills), Commercial paper
Capital market: market for securities with maturities longer than one year
Bonds, Common stock
Capital market are less marketable, higher defauft risk and have longer maturities
Public and private markets
Public markets are organized financial markets where the general public buys and sells securities through their stockbrokers
Private markets involve direct transactions between two parties, often called private placements
Advantages: faster, lower transaction costs
Disadvantages:
Privately placed securities cannot legally be sold in the public markets because they lack SEC registration
Dollar amounts that can be raised tend to be smaller
Futures and options markets
Derivative securities derive their value from some underlying asset
Futures Contract: contracts for the future delivery of assets such as securities, foreign currencies, interest cash flows, or commodities
Options Contract call for the option writer to buy or sell an asset if called upon to do so by the option buyer
Both futures and options can be used to hedge risk
Efficient market hypothesis a theory concerning the extent to which information is reflected in security prices and how information gets incorporated into security prices
Strong-Form Efficiency
Security prices reflect all information, both public and private
Even inside information is reflected in prices
Semistrong-Form Efficiency
Security prices always reflect all public information
Inside, or confidential information, is not reflected in prices
Weak-Form Efficiency
Security prices only reflect historical information
amortization describes the way in which the principal (the amount borrowed) is repaid over the life of a loan.
amortization schedule a table that shows the loan balance at the beginning and end of each period, the payment made during that period, and how much of that payment represents interest and how much represents repayment of principal
With an amortizing loan, some portion of each loan payment goes to paying down the principal
Columns:
Year
Beginning principal balance (1), last year’s Ending Principal Balance
Total monthly/annual payment (2), same every period (CF)
Interest payment (3)
Principal paid (2) - (3) - (4)
Ending Principal Balance (1) - (4) - (5)
Finding interest rate: must use trial and error or calculator
Future value of an Annuity
Future value of an annuity computations typically involve some type of saving activity, such as a monthly savings plan
Another application is computing future values for retirement or pension plans with constant contributions
Given that FVAn=PVAn×(1+i)n, substituting PVA
FVAn=iCF×[1−(1+i)n1]×(1+i)n
FVAn=iCF×[(1+i)n−1]
FVAn=CF×[i(1+i)n−1]=CF×FV annuity factor
Annuities due:
an annuity in which payments are made at the beginning of each period
The present or future value of an annuity due is always higher than that of an ordinary annuity that is otherwise identical
the first cash flow occurs at the beginning of the first period
Annuity transformation method:
Annuity due value=Ordinary annuity value×(1+i)
Level cash flows: perpetuities:
A perpetuity is a series of equally spaced and level cash flows that goes on forever
The most important perpetuities in the securities markets today are preferred stock issues
Perpetuities:
A stream of equal cash flows that goes on forever
Equation for the present value of a perpetuity can be derived from the present value of an annuity equation
PVP=iCF if cash flow is at the end of the first period
Cash flows that grow at a constant rate
Growing annuity
Equally-spaced cash flows that increase in size at a constant rate for a finite number of periods
PVAn=i−gCFi×[1−(1+i1+g)n] where CFi is cash flow one period in the future (CF0∗(1+i%))
only when the growth rate is less than the discount rate
Growing perpetuity:
Equally-spaced cash flows that increase in size at a constant rate forever
PVP=i−gCFi where CFi is cash flow one period in the future (CF0∗(1+i%))
The affective annual interest rate
Annual Percenrage Rate, APR: periodic rate × nb of periods
effective annual interest rate, EAR: annual interest rate that takes compounding over the course of a year into account
EAR = (1+mAPR)m−1
The Appropriate Interest Rate Factor: any time you do a future value or present value calculation, either use the interest rate per period (quoted rate/m) or the EAR as the interest rate factor
8. Bond valuation and structure of interest rate
Corporate bonds
Market for corporate bonds
The most important investors are life insurance companies, pension funds, and mutual funds
Transactions tend to be in very large dollar amounts
less efficient compared to stocks or U.S. treasury bills and bond
Bond price information:
Only a small fraction of the bonds outstanding are traded each day
Mostly negotiated directly between the buyer and seller, with limited centralized reporting of the sales
Corporate bond:
A type of Fixed-income securities: debt instruments that pay interest in amounts that are fixed for the life of the contract
Features of corporate Bonds:
Long-term claims against company assets
Face, or par, value is $1,000
Coupon rate is the annual coupon payment (C) / bond’s face value (F)
Coupon payment is a fixed amount paid to lenders for the life of the contract (typically with a semiannual or annual payment)
Types of corporate bonds:
Vanilla bonds, debentures, are unsecured:
Coupon payments fixed for the life of the bond
Repay principal and retire the bonds at maturity
Contracts have the features and provisions found in most bond covenants
Annual or semiannual coupon payments
Zero coupon bond:
No coupon payment, only face value at maturity
Sold at a discount compared to face value
Convertible bonds:
May be exchanged for shares of the firm’s stock
Sell for a higher price than a comparable non- convertible bond
Bondholders benefit if the market value of the company’s stock gets high enough
Bond valuation
Steps:
estimate the expected future cash flows
determine the required yield, rate of return, or discount rate (depends on riskiness of the future cash flows)
market interest rate
compute present alue of future cash flows
Bond valuation formula:
Then PB (current value/price of a bond = PV (present value of coupon payments) + PV (present value of Principal payment)
PB=(1+i)C1+(1+i)2C2+...+(1+i)nCn+Fn
Par, premium and discount bonds
Par bond: If a bond’s coupon rate is equal to its yield, the price will equal the face value
Premium bond: If a bond’s coupon rate is more than its yield, the price will be higher than the face value
Likely to happen when interest rates are falling
Discount bond:
If a bond’s coupon rate is less than its yield, the price will be less than the face value
Likely to happen when interest rates are rising
Semiannual compounding:
i=i/m
C=C/m
Zero coupon bonds: discount simply
PB=(1+i/m)mnFmn
Bond yields:
YTM, Yield to maturity:
actual rate of return (if buy bond now) != interest rate (used to calculate what bond price should be)
EAY, Effective annual yield:
EAY=(1+mquoted interested rate)m−1
quoted interested rate = nb of periods * YTM
Realized Yield: return earned on a bond given cash flow actually received
Interest rate risk
uncertainty about future bond values due to the unpredictability of interest rates
Bond theorems:
Bond prices are inversely related to interest rate movements
interest rate increase → more discount → cheaper present value
For a given change in interest rates, prices on longer-term bonds change more than prices of shorter-term bonds
longer-term bond’s present value discount much more or much less compared to shot-term bond
For a given change in interest rates, prices of lower-coupon bonds change more than prices of higher-coupon bonds
more capital concentrate at longer period discounts
→long term, zero coupon is most sentitive
Bond theorem application: if interest rates are expected to increase, avoid long-term bonds
If interest rates are expected to decrease, buy zero-coupon bonds
Call provision: allow bond issuer to purchase a bond from bondholder at a pretermined price before maturity
more likely to be called when interest rates decline
CIP, call premium, =icallable−inon-callable>0
Default risk: borrow might not pay back interest and or principal
DRP, default risk premium, =idr−irf>0
interest for default risk - interest for risk-free rate
Bond ratings: rank bonds in order of probability of default
Investment grade / noninvestment grade
State and federal laws typically require commercial banks, insurance companies, pension funds, certain other financial companies, and government agencies to purchase only investment-grade securities
The term structure of interest rate
refers to the relationship between yield to maturity and term-to-maturity on a bond
Yield curve:
Ascending or normal yield curves slope upward from left to right and imply higher interest rates are likely
Descending or inverted yield curves slope downward from left to right and imply lower interest rates are likely
Flat yield curves imply interest rates are unlikely to change
Factors that shape the yield curve:
Real rate of interest
Expected rate of inflation:
if higher inflation is forecast, the YC slope upward because longer-term yields will contain larger inflation premium than shorter-term yields
interest rate risk
The longer the maturity of a security, the greater its interest rate risk (the risk of selling the security at a lower price) and the higher the YTM
The interest rate risk premium adds upward bias to the slope of the yield curve
Cumulative effect of factors that shape the yield curve:
In an economic expansion
The real rate of interest and inflation premium increase monotonically
Interest rate risk increases
In an economic contraction
The real rate of interest and inflation premium decrease monotonically
Interest rate risk decreases
Yield curve to recession:
expectation: investors expect long-term to have lower interest rate and inflation rate
9. Stock valuation:
Market for stocks:
secondary market
NASDAQ
NYSE
The world’s stock exchange
Efficiency of secondary markets
4 types of secondary market, order from least to most efficient:
Direct search: cost of locating and negoriating
Broker: cost of commission paid to broker who bears the cost
P0=t=1∑∞(1+R)tDt where R is required rate of return
doesnt yet account for selling stock
only for dividend forecasts
doesnt include assumptions:
growth rate is constant
forecasting dividends or when shares are sold
Growth stock pricing paradox
stock of a company whose earnings are growing at an above-average rate and are expected to continue to do so for some time
Rapidly-growing firms
Typically pay no dividends on common stock in the growth phase
Have many high-return investment opportunities, making investors are better off if firms reinvest earnings
shares of a company that will never pay cash to investors are worthless
In reality, high-growth firms will eventually pay dividends
If investments made with reinvested funds succeed, a firm’s net cash inflows should increase significantly and investors can sell their stock at a much higher price than what they paid
Stock valuation: some simplifying assumptions
These apply for both common stock and preferred stock
Zero-growth dividend model:
P0=RD
Constant growth dividend model:
Dt=D0×(1+g)t
P0=R−gD1 where D1 is dividend in year 1
Computing future stock prices:
Pt=R−gDt+1
Mixed (supernormal) growth dividend model:
If the supernormal growth occurs first and is followed by constant dividend growth, we can combine equations
It can be proven that portfolios with more than one asset is always less risky
Risk can be reduced by creating a portfolio using assets having different risk charatersistics
Limits:
When the number of assets in a portfolio is large, adding another stock has almost no effect on the standard deviation
Most risk-reduction from diversification may be achieved with 15 to 20 assets
Diversification can virtually eliminate risk unique to individual assets, but the risk common to all assets in the market remains
unsystematic or diversifiable: risk that can be eliminated through diversification
systematic or nondiversifiable: risk that cannot be eliminated through diversification
Systematic risk (market risk)
Well-diversified portfolios contain only systematic risk
Competition among diversified investors will drive the prices of assets to the point where the expected returns will compensate investors for only the systematic risk
Measuring systematic risk:
The market’s influence on a stock’s return is quantified in the stock’s beta
If the beta of an asset is:
Zero, the asset has no measurable systematic risk
Greater than one, the systematic risk for the asset is greater than the average for assets in the market
Less than one, the systematic risk for the asset is less than the average for assets in the market
Risk Premium:
Compensation for Bearing Systematic Risk
E(Ri)=Rrf+ Compensation for bearing Systematic riski
returned on risky asset = risky free rate + risk premium
illustrates the CAPM’s prediction for the required expected total return for various values of beta
expected return greater than the required return estimated with the CAPM → the expected return plot above the SML →underpriced
expected return less than the required return estimated with the CAPM → the expected return plot below the SML →overpriced
10. Fundamental of capital budgeting
Introduction:
The Capital Budgeting Process
Starts with the firm’s strategic plan which describes its strategy for the next three to five years
Division managers then convert the firm’s strategic objectives into business plans
The capital budget is generally prepared jointly by the CFO’s staff and financial staff at the divisional and lower levels, reflecting the activities outlined in the divisional business plans
steps:
Idea generation
Investment analysis
capital allocation planning
monitoring and post-audit
Key Reasons for Making Capital Expenditures: ranked from least to most risky
replacement: an asset will have to be replaced rather than repaired or overhauled
an expansion: new equipment to produce more products or expansion of the firm’s distribution system.
new products and services: involve more stakeholders and higher degrees of risk
regulatory, safety and environmental: required by third party, such as the gov or insurance company, to meet specified standards.
Others: such as management pet proejects and high-risk investments which falls outside normal project analyses
Source of information:
generated internally, often beginning with the sales force
Next the production team gets involved, followed by accountants
All the information is reviewed by financial managers who evaluate the feasibility of the project
Classification of investment projects;
Independent projects: accept or reject doesnt influence decision about other projects being considered
when resources are not limited
Mutually exclusive projects: only 1 or the other
Contingent projects: one project depends on on another’s acceptance
Basic capital budgeting terms:
cost of capital: rate of return that a project must earn to be accepted by management
riskier → higher cost of capital
capital rationing: a firm with limited funds choose the best projects to undertake
NPV compares the PV of expected benefits and cash flows from a project tp the PV of expected costs
if benefit > cost, the project is feasible
NPV techniques
NPV = PV of expected inflow - PV of expected cash outlow = Cash inflow - Cash outflow
when NPV = 0, IRR = cost of capital → still profit (atleast beat inflation)
5 steps:
Determine the intial cost of starting the project? next lec
estimate the project’s future cashflows over its expected lift? next lec
find the riskiness of the project and appropriate cost of capital
the risker a project, the higher its cost of capital
compute the project’s NPV
make a decision
Mutually exclusive projects and NPV
managers should allocate capital to the project that has the most positive dollar impact on the value of the firm—in other words, the project with the highest NPV
Key advantage:
use discounted cash flow valuation
provide a direct (dollar) measure of how much capital that project will increase firm’s value
consistent with the goal of maximizing stockholder value
Decision: Payback period ⇐ payback cutoff point → accept
advantages:
easy to calculate and understand
simple measure of a project’s liquidity risk
disadvantages:
Simple payback period doesnt account for TVL
doesnt consider cash flows past payback period
bias against long-term projects
arbitrary cutoff point
Internal Rate of Return (IRR)
Definition:
The discount rate which a firm’s cost of capital to the rate-of-return that makes the net cash flows from a project equal its cost
discount rate that makes NPV = 0
Calculating IRR: with trial and error method
When IRR and NPV agree?
evaluating independent projects
projects’ cashflows are conventional, ones with intial cash outflow followed with cash one or more inflows
When IRR and NPV disagree?
unconvential cash flows → might have multiple IRR
mutually exclusive project
→ always go for NPV
IRR for mutually exclusive projects:
a discount rate at which the NPVs of two mutually exclusive projects will be equal
that rate is the crossover point
Depending on whether the required rate of return is higher or lower than the crossover rate, the ranking of the projects will be different
It is easy to identify the superior project based on NPV, but it cannot be done using IRR due to ranking conflicts
→ if cost of capital < crossover rate: take project A
IRR vs NPV:
IRR assumes that cash flows from a project are reinvested to earn with the rate of IRR while NPV assumes that it will earn the firm’s cost of capital
explain for IRR: for example, positive cashflow at somewhere in the middle is discounted forward, that means it is assumed to be reinvested at same rate
optimistic assumption in the IRR method leads to some projects being accepted when they should not
because the reinvested cash flows cannot earn the IRR
Summary for IRR:
if IRR > cost of capital → accept
advantages:
intuitive and easy to understand
based on discounted cash flow technique
disadvantages:
With nonconventional cash flows, IRR approach can yield no usable answer or multiple answers
A lower IRR can be better if a cash inflow is followed by cash outflows
With mutually exclusive projects, IRR can lead to incorrect investment decisions
IRR calculation assumes cash flows are reinvested at the IRR
Modified IRR (MIRR)
IRR is too optimistic → MIRR assumes the cash flow to be reinvested at firm’s cost of capital
TV = Sum of FV value
MIRR is the rate for which PVcost=(1+MIRR)nTV
Investment Decisions with Capital Rationing
Capital rationing in a single period
Profitability Index (PI) provides a measure of the value of project generates for each dollar invested in that project
Useful for capital rationing when firms have limited resources and therefore cannot invest in all projects that have a positive NPV
Consistent with the idea of shareholder wealth maximization
Practitioners’ Methods of Choice: IRR is currently popular
Postaudit and Periodic Reviews:
Management should systematically review the status of all ongoing capital projects and perform post-audits on completed capital projects
A review should challenge the business plan, including cash flow projections, cost assumptions, and the performance of people responsible for implementing the capital project
A post-audit examination may reveal why a project was successful or failed to achieve its financial goals
11. Cash flows and capital budgeting
Calculating project cash flows:
Capital allocation assumptions:
Decisions are based on cash flows (not net income/op income which are done in (Accrual Basis Accounting)
Cash flows are not accounting net income or operating income
Cash flows are based on opportunity costs
Cash flows are analyzed on after-tax basis
Timing of cash flows is crucial
Financing costs are ignore
Incremental after-tax free cash flows (FCF):
the total after-tax free cash flows the firm would produce with the project, less the total after-tax free cash flows the firm would produce without the project
FCFproject=FCFfirm with project−FCFfirm without project
left-hand side: total market value of assets, the present value of total cash flows that those assets are expected to generate in the future
value of investors’s claims must be equal to value of cash flows they have a right to receive
total market value of the debt and equity of a firm is the present value of the cash flows that the debt holders and stockholders have the right to receive
MV of Assets = MV Current Assets + MV of PPE + MV other asset = MV of Liabilities + MV of Equity
The overall cost of capital structure is what it costs the company to raise additional capital using the specified mixture of debt and equity
Importance of cost of capital:
basis of appraising new capital expenditure proposals
recommended risk-free rate is the rate on long-term treasury security
beta can be estimatd with regression analysis, but much more complicated if common stock is not publicly traded
market risk premium is not possible to be observed, analysts generally use a measure of avg risk premium investors have actually earned as an indicator
constant growth divident model: solve for required rate of return
P0=R−gD1
→kcs=P0D1+g
must estimte the dividend that stockholders will receive in next period, D1 as well as rate ,g, that the market expect in long term
multistage-growth dividend model: solve for required rate of return
Preferred stock
Characteristics of prefered stock allow us to use the perpetuity model to estimate cost of preferred equity
P0=RD→kps=PpsDps
Using the WACC in practice
Limitations of WACC as a Discount Rate for Evaluating Projects
financial theory tells us that rate should be used to discount these incremental cash flows is the rate that reflects their systematic risk
→ WACC is going to the appropriate discount rate for evaluating a project only when the project has cash flows with systematic risks that are exactly the same as those for the firm as a whole
WACC = xdebtkdebt-pretax(1−t)+xpskps+xcskcs
should use market values rather than book values
donot include retained earning
conditions for using the WACC:
Alternatives to using WACC:
14. Working capital management
Working capital basics
Involves 2 key issues:
what is the appropriate amount and mix of current assets to hold
how should these current assets be financed
Terms and concept:
current assets: cash and other assets that the firm can convert into cash in a year or less
current liabilities: obligations that the firm expects to pay off in a year or less
working capital: funds invested in a company’s cash account, account receivables, inventory, and other current assets
NWC: current assets - current liabilities
working capital efficiency: length of time between when a working capital asset is acquired and when its converted into cash
liquidity: ability of a company to convert real or financial assets into cash quickly and without loss of value
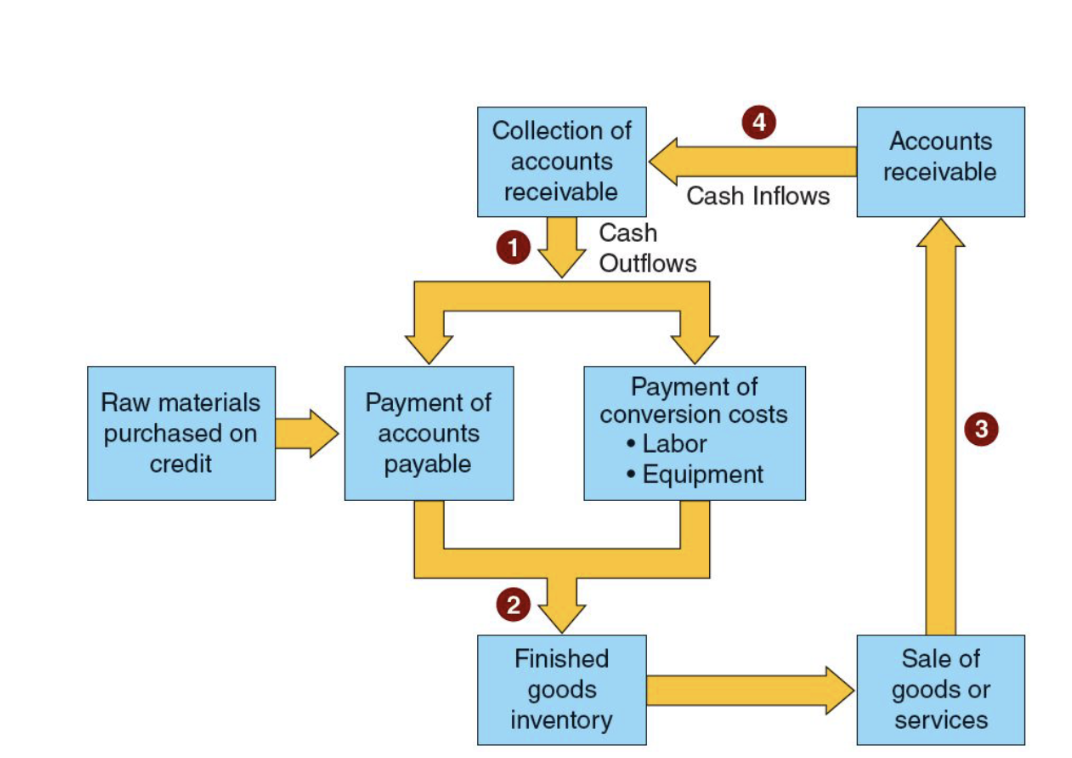
The operating and cash conversion cycles
Cash conversion cycle: the point a company pays for raw materials until the point it receives cash from sales
Sequence of events:
use cash to pay for raw materials and costs of conversion
finished goods are hold in inventory
finished goods are sold on credit
customers repay credit
Cash conversion cycle:
Goals of financial managers:
delay paying accounts
maintain minimum raw material inventories
to use as little labor as possible
maintain minimal finished goods in inventories
offer customers the most attractice credit terms
collect cash payments as fast as possible
Operating cycle:
begins when cash is used to purchase raw materials and ends when cash is collected (debit or credit)
=DSI+DSO
Cash Conversion Cycle
starts when the firm actually pays for inventory until when cash is received
can be negative
=DSI+DSO−DPO=Operating cycle−DPO
Days’ Sales in Inventory (DSI) shows how long the firm keeps its inventory before selling it
→ if cost of capital < crossover rate: take project A